My server was hacked
Scroll to the bottom to see TLDR
2 days back, on one of my servers I had a CPU high usage alert. It’s a Hetzner box for most of my self-hosted services managed via Terraform and Ansible1. I thought it was temporary (big mistake) and since my on-call days were over, I went to bed. I noticed the alerts were still open in the morning flooding my email and personal slack channels.
I opened up the Grafana dashboard and saw this consistent high CPU for more than 12 hours:
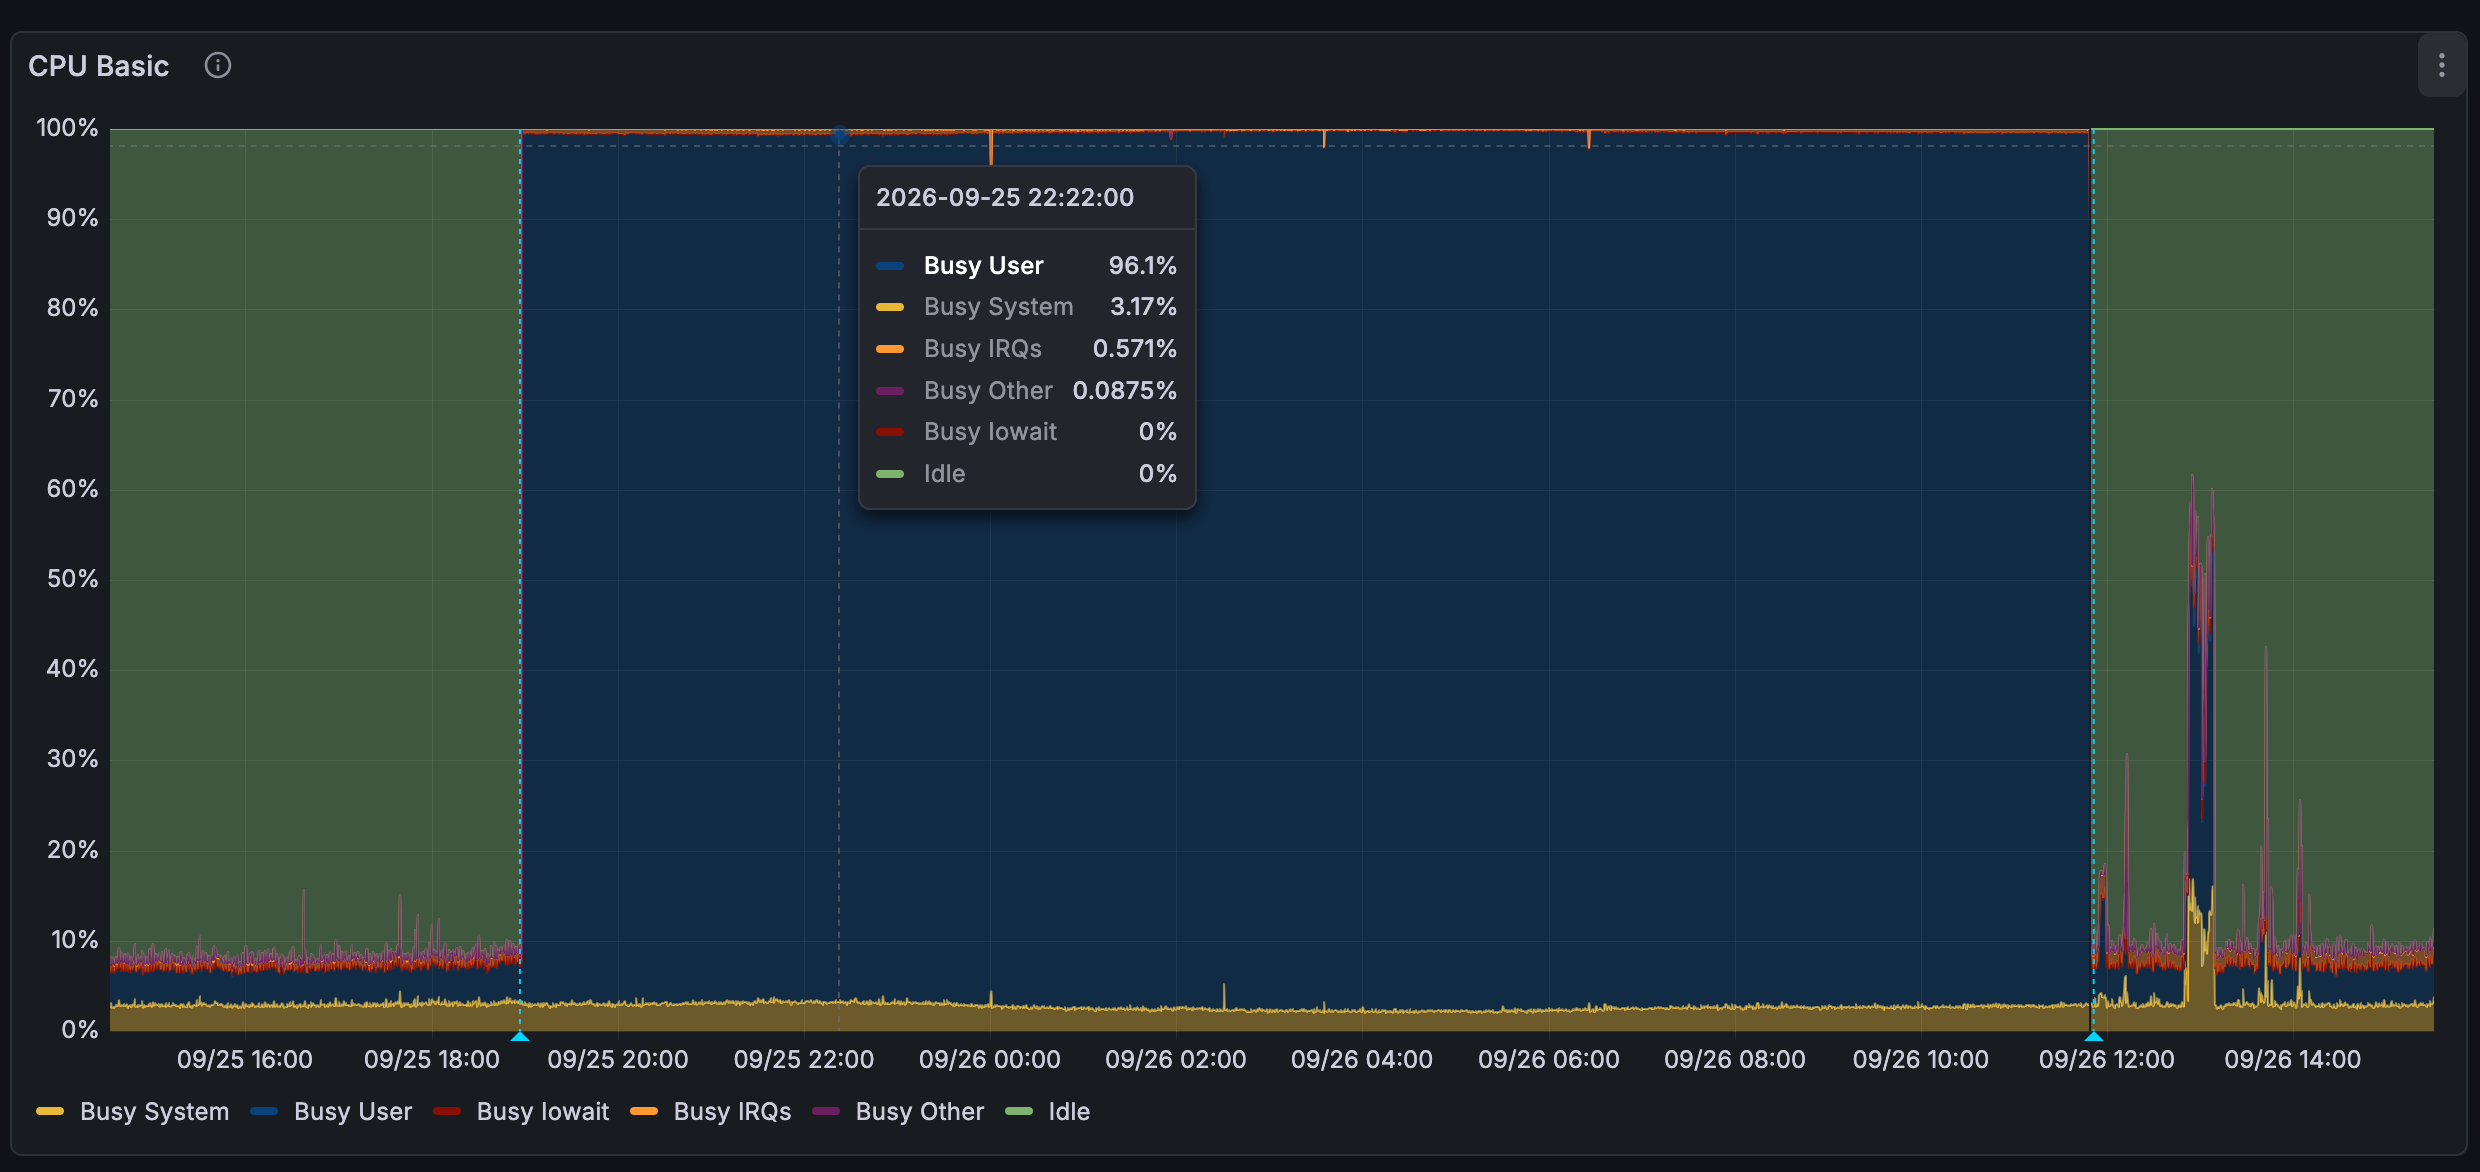
Obviously something was wrong. I SSHed to the machine, ran htop and found the process syslog-ng taking most of the CPU.
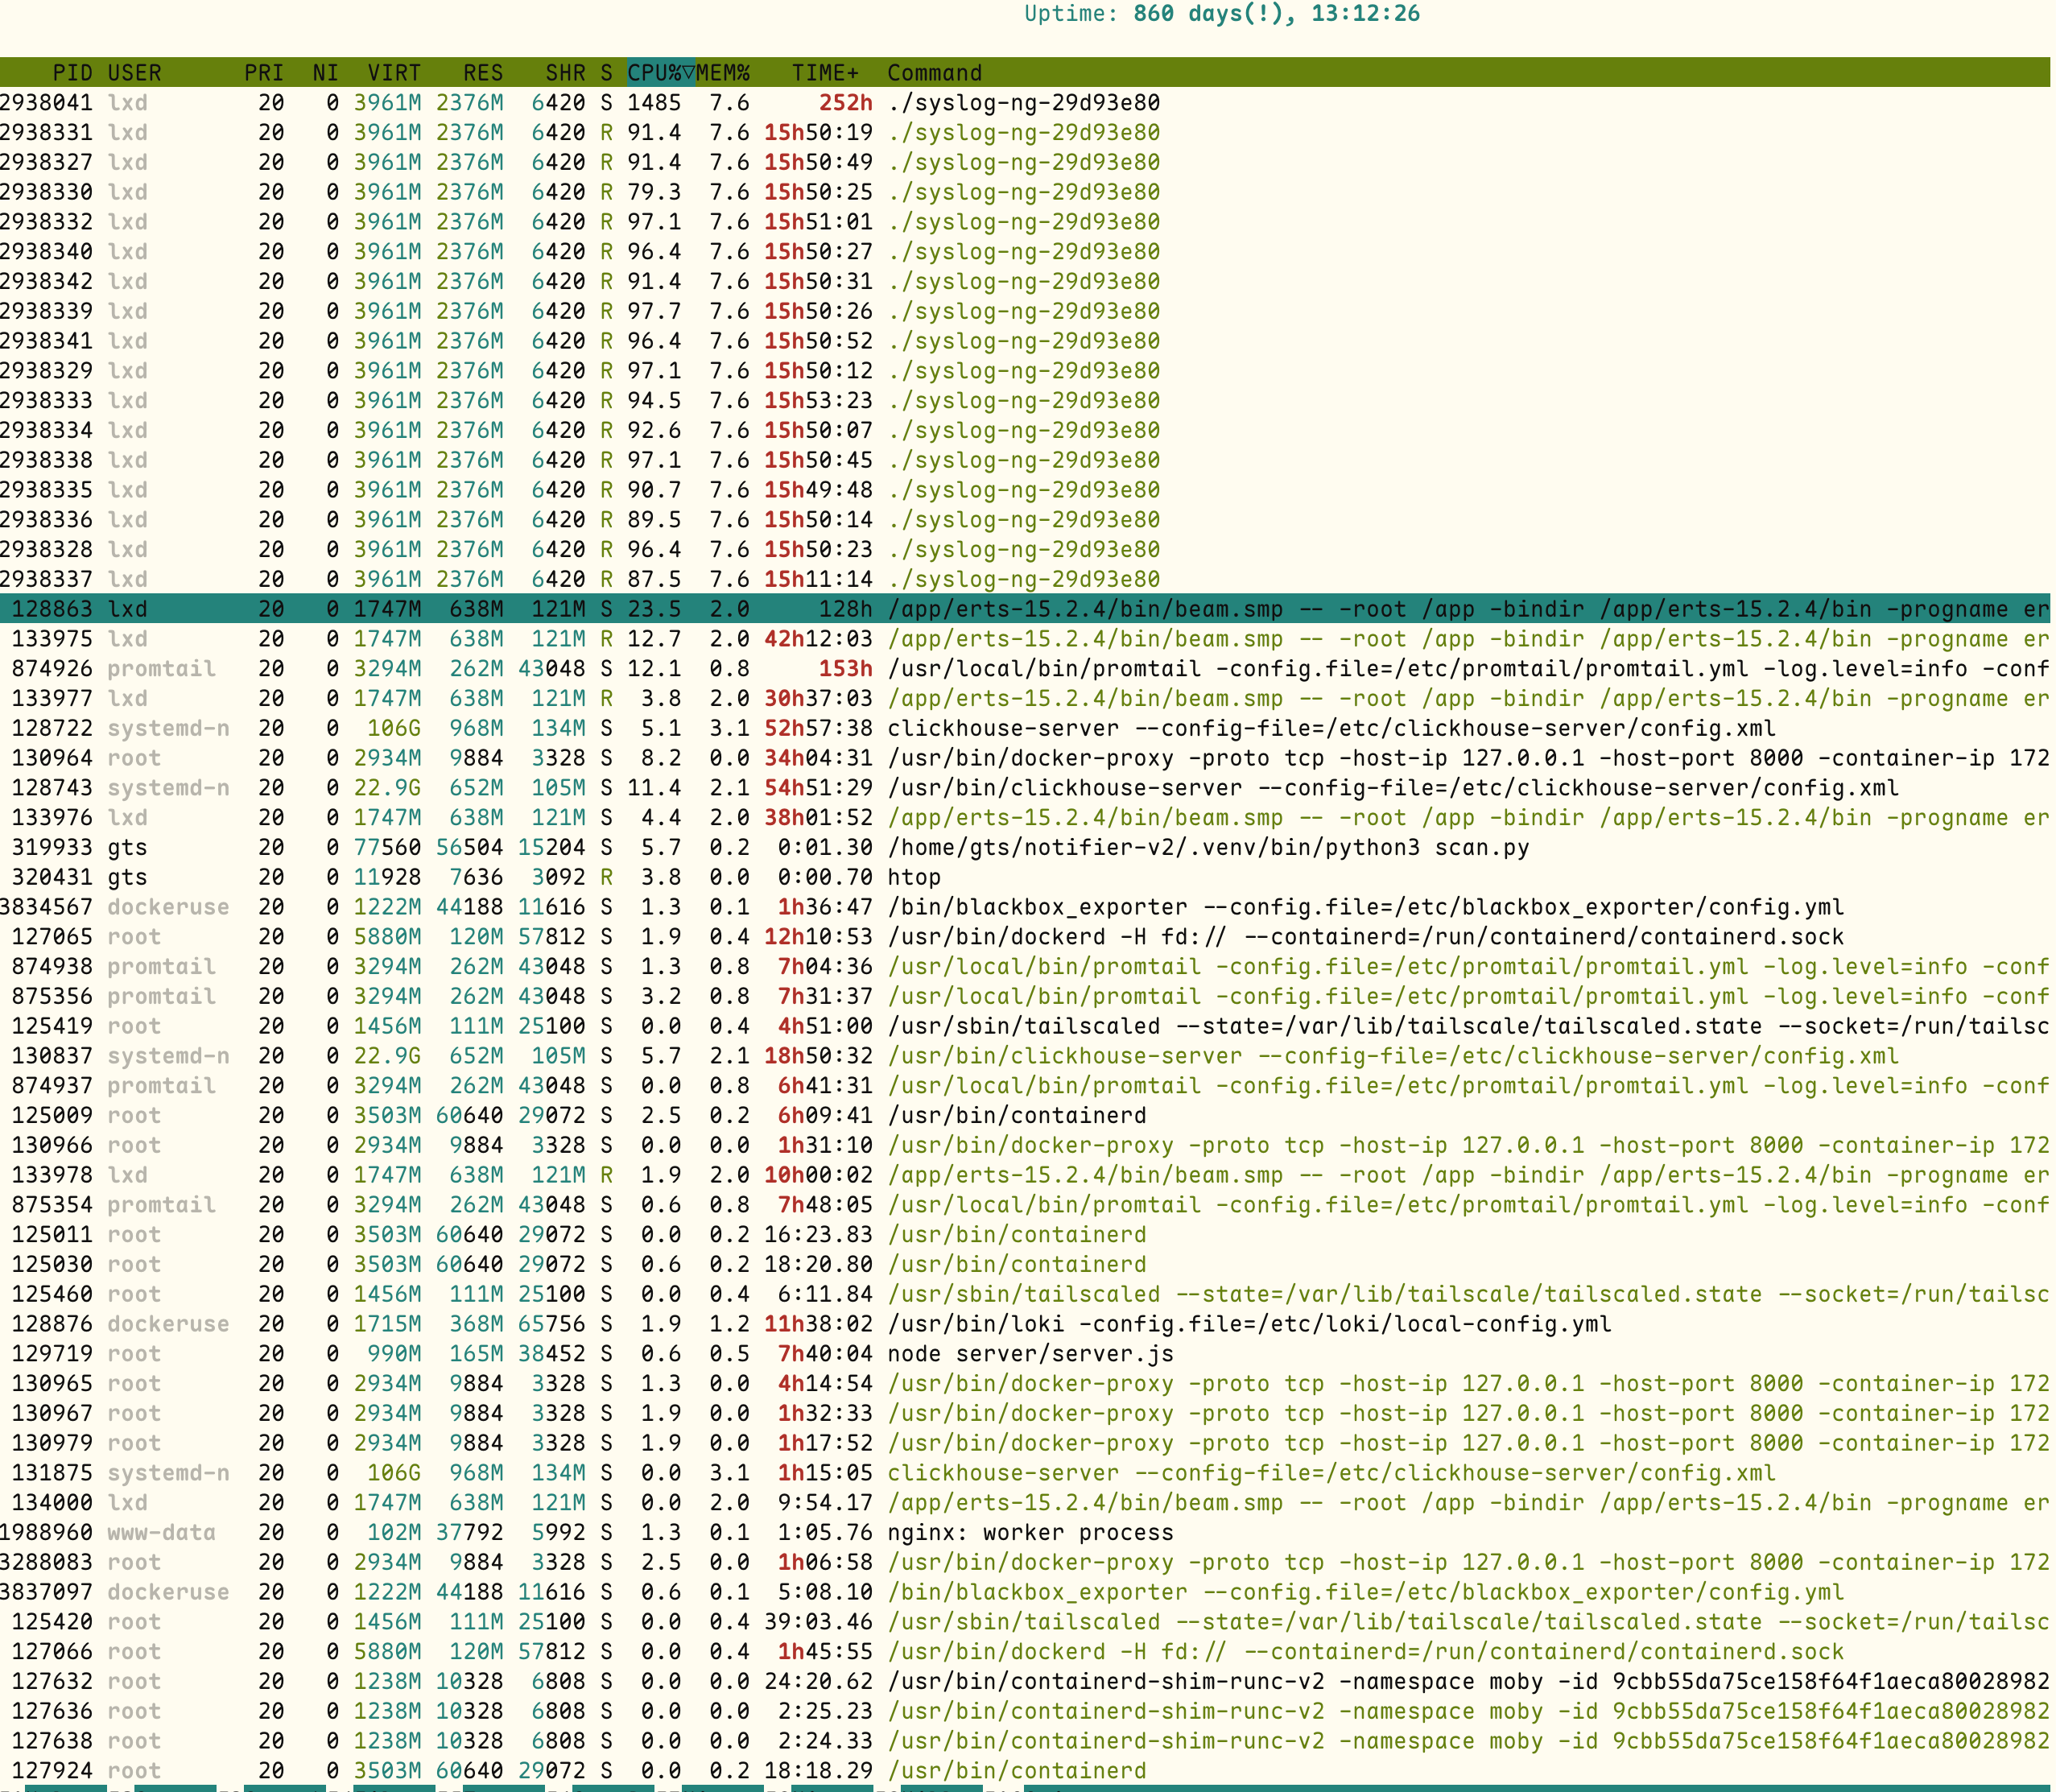
Weird and I had no clue why that is. Maybe some logging process was consuming too many CPU cycles? Since I just installed the gcx some days before and I ran way too many containers, I thought why not hand this over to LLM. I started a pi session with gpt-6-sol, gave the context to it and it quickly narrowed the high CPU spikes to the plausible container. In less than a minute, it reported the following:
The server's CPU spike is dominated by a suspicious process inside the Plausible container. At inspection, the host load was about 20 on 16 cores, and `syslog-ng-29d93e80` was using roughly 1,500% CPU—about 15 cores.

The process started on September 25 at 18:57 UTC. Its executable ran from a hidden directory under `/var/tmp`, has since been deleted, and has an established connection to `141.95.72.61:443`. Those findings are consistent with a compromise, potentially a cryptominer, but I have not confirmed the binary’s purpose. I made no changes to the server.

Treat `plausible-plausible-1` as potentially compromised. Preserve evidence before stopping or recreating it, then investigate how the process was launched and whether the host or other containers were affected. Separately, `gcx` could not query historical metrics: its active `default` context has no Grafana stack configured, despite the earlier login.
So, my server had been compromised. gcx did not work because I had not logged into my self-hosted Grafana instance from my Mac Mini. The agent found the suspicious process after I asked it to investigate the server’s CPU spike over SSH and use gcx if needed.
I rebooted the server (knee-jerk reaction), logged into gcx and post reboot I couldn’t see the CPU spiking. I then checked Plausible’s GitHub releases for security updates and found that v3.2.1 was a security release. I was running v3.0.1.
I asked for the evidence of the compromise and the LLM showed the container logs:
13:27:42  Malware name: syslog-ng-29d93e80
13:27:42  Deploying to: /var/tmp/.syslog-303df1f0
13:27:42  Using GitHub official XMRig v6.26.0
13:27:50  Multi-pool config downloaded from: .../banner-v2_800x800.jpg
13:27:50  Miner pretends as: syslog-ng-29d93e80
13:27:50  Daemon pretends as: syslog-helper
13:27:51  Miner started (PID: 805)
13:27:52  Daemon running (PID: 834)
It looked like my outdated Plausible instance had been exploited. I had not confirmed the exact entry point. I then proceeded to do the following:
- upgraded Plausible to the latest version.
- blocked
/storybookendpoint in my nginx config for Plausible. - checked the database for any new users in the plausible db container.
- checked the other containers and found no evidence that they were affected (till now).
- installed renovate to notify and raise PR in my git repo for my terraform modules and the docker containers.
In hindsight, one mistake I made was not enabling backups for this server in Hetzner. I had only a manual snapshot from 15 days earlier, which was too stale to restore.
A friendly reminder to keep your services and dependencies updated!
TLDR: My outdated Plausible OSS instance was compromised and used for crypto mining. A relevant security fix had already been released, but I didn’t upgrade which could be the entry point for the attacker.
-
I have cloned most of this setup from Jake Howard’s IaC a while ago. Thanks Jake! ↩